

Oerlemans reported in 2005 in the journal Science that a temperature history was assembled for different parts of the world from 169 glacier length records. Using a first-order theory of glacier dynamics, the author related changes in glacier length to changes in temperature. The derived temperature histories are fully independent of proxy and instrumental data used in earlier reconstructions. Moderate global warming started in the middle of the 19th century. The reconstructed warming in the first half of the 20th century is 0.5 kelvin. This warming was notably coherent over the globe. The warming signals from glaciers at low and high elevations appear to be very similar.
The author concluded that The derived global temperature record is in broad agreement with other reconstructions and for the last part also with the instrumental record. However, the glacier reconstruction shows a somewhat larger amplitude on the century time scale. Because glaciers need time to react and the number of records drops sharply after 1995, the warming seen in the instrumental record over the past 15 years is not yet reflected in the reconstruction. Temperature curves appear to be very similar for glaciers with low and high median elevation. Low and high glaciers are classified as glaciers with median elevation below and above 2850 m, respectively. For this threshold, the number of glaciers in both classes is approximately equal. Although the evidence is not conclusive because only a limited altitudinal range is considered, the glacier record does not show any sign of a height dependence of the global warming signal.
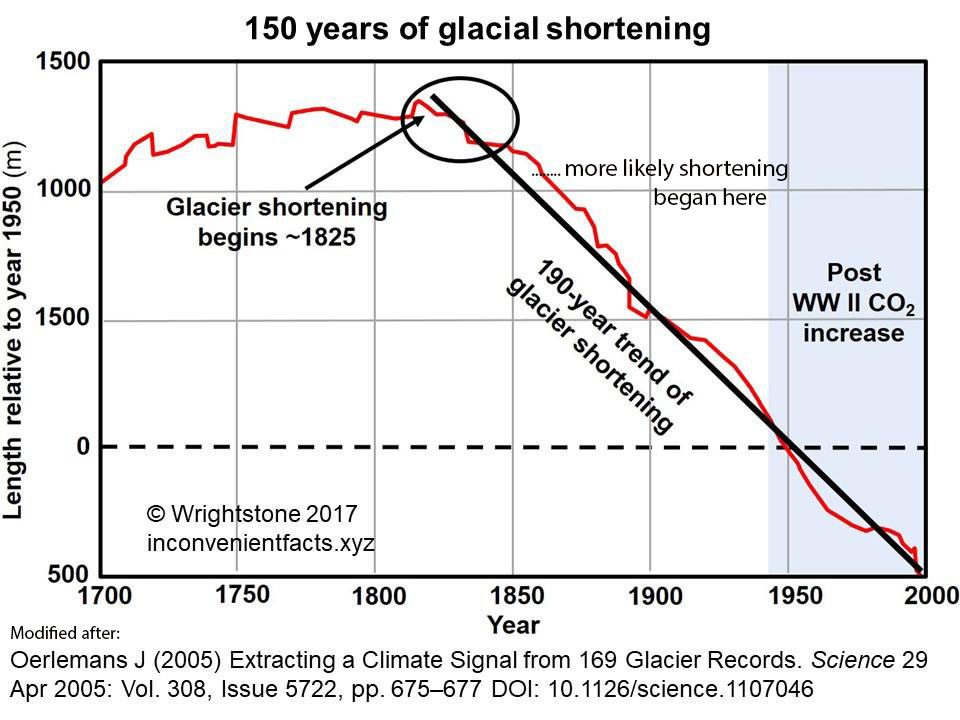 Glaciers witnessed a particularly strong warming at high northern latitudes in the first decades of the 20th century. Unlike the global mean signal, reconstructed temperature shows a minimum in the second half of the 19th century, when the Northern Hemisphere mid-latitudes were already warming up. The temperature reconstruction presented here is fully independent of other sources (proxy or instrumental). It thus provides complementary evidence on the magnitude of the current global warming, on the time that this warming started, and on the notion that in the lower troposphere the warming appears to be independent of elevation. [On the basis that the data hump shown in the figure above may be a result of limited data or due to normal earth variations, we indicated in the figure when the likely onset of human impact began to be notable as a result of human- caused fires, early railroad operations, and industrial use of wood and coal for heating and generating power and later electricity].
Earlier work by author:
1999: http://www.i2mconsultants.com/downloads/corp/Glacio-Meteorological_Investigations_On.pdf
1998: http://www.i2mconsultants.com/downloads/corp/Oerlemans.glac.pdf
1994: http://www.i2mconsultants.com/downloads/corp/oerlemans_94_quantifying_global.pdf
Managed & Built by I2M Consulting, LLC | © 2010-
