

American Uranium reported in late January 2026 that the Petrotek test report confirms that hydrogeological test values are consistent with other
permitted and operating ISR uranium mines in Wyoming’s southern Powder River Basin ahead of 2026 MRE and Scoping Study updates at AMU’s flagship Lo Herma ISR Project.
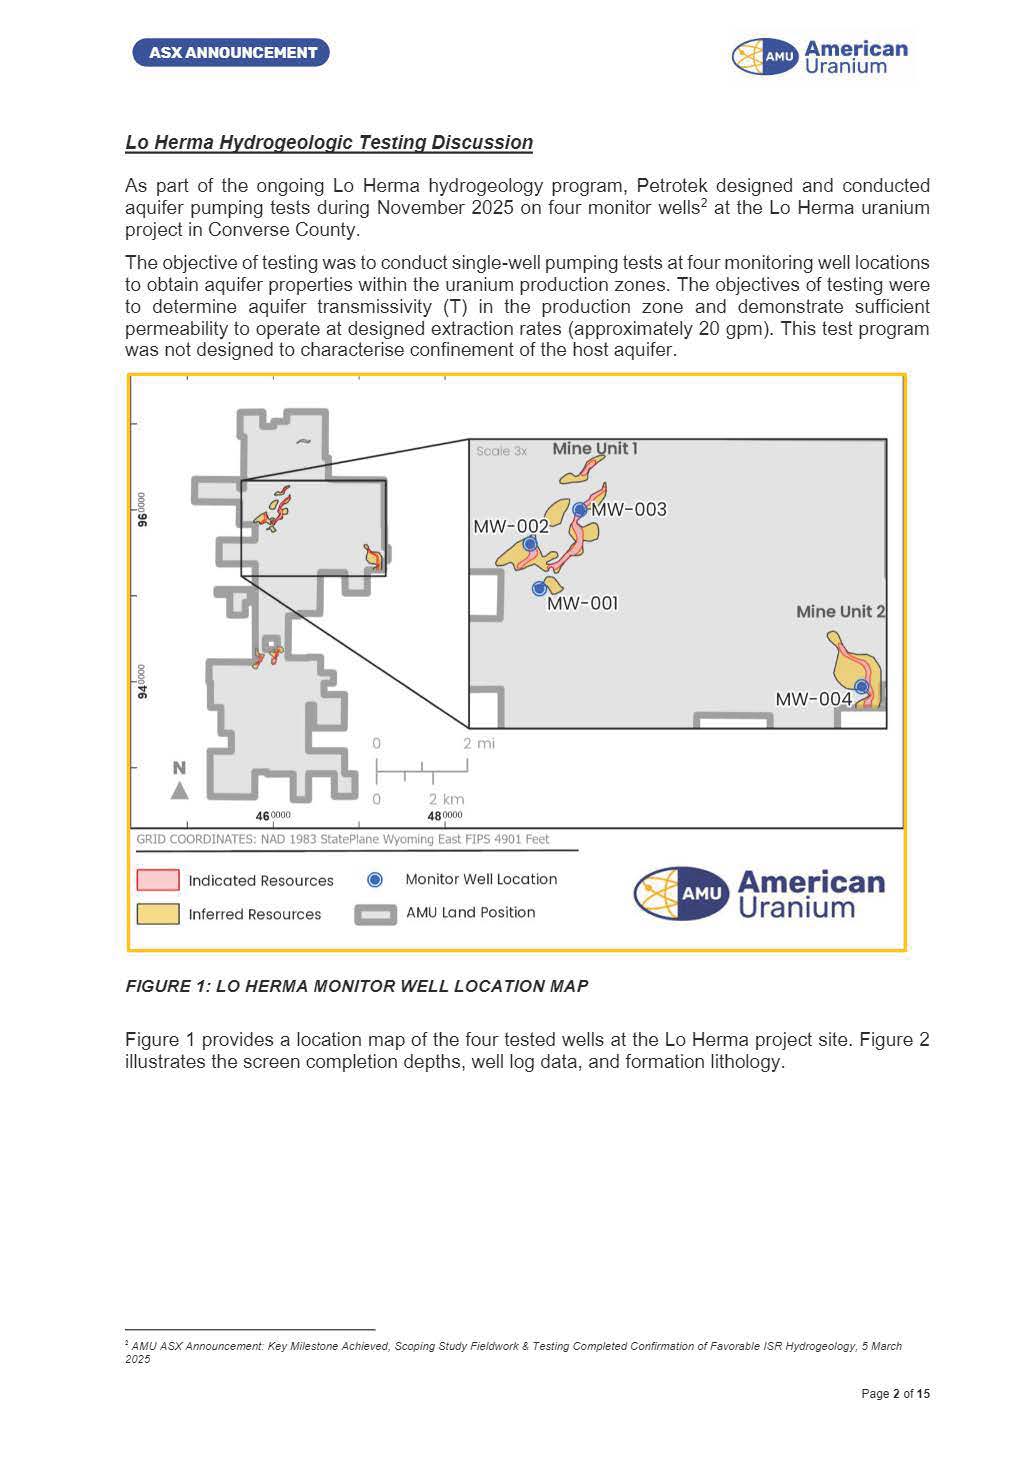
FIGURE 1: LO HERMA MONITOR WELL LOCATION MAP
Highlights:
- Petrotek report confirms hydrogeological test values are consistent with other nearby permitted and operating ISR facilities in Wyoming’s southern Powder River Basin,
- Observed well extraction rates and aquifer behavior support the Scoping Study’s assumed pumping rate of 20 gpm, typical of nearby ISR uranium projects in Wyoming,
- Petrotek’s report helps prepare for an intensive hydrogeological study commencing in 2026 to support permitting and detailed ISR production wellfield design at Lo Herma,
- Hydrogeological and drilling programs are targeted to de-risk and advance Lo Herma towards a planned Mineral Resource update this quarter and a Scoping Study update in the second half of 2026
American Uranium Limited is pleased to advise that Petrotek Corporation (Petrotek) has provided the hydrogeological test report for aquifer pump testing undertaken during November 2025 at the Lo Herma ISR uranium project in Wyoming’s Powder River Basin. These pump test results represent a critical milestone in the development of the Lo Herma ISR uranium project, as they provide empirical evidence of the aquifer's transmissivity, hydraulic
conductivity, and overall productivity within the uranium-bearing host sands.
By demonstrating that groundwater extraction wells can operate at a flowrate of 20 gallons per minute (gpm) and aquifer drawdown is consistent with established ISR operations in the southern Powder River Basin, the findings de-risk the project by confirming favourable aquifer characteristics for in-situ
uranium mining.
As recommended by Petrotek, the next phase of hydrogeologic study will include development of a regional hydrogeologic conceptual model to better understand the regional deposition of potential mining sands and confining intervals. Additional pump tests will be designed for localscale evaluations of the production zones and adjacent overlying/underlying units to confirm hydraulic confinement for the purposes of permitting and ISR production well field design.
AMU CEO and Executive Director Bruce Lane commented:
“Aquifer testing at Lo Herma demonstrated sustained flows and minimal drawdown across all four wells, with Petrotek confirming aquifer conditions consistent with other permitted ISR uranium mines nearby in Wyoming’s southern Powder River Basin. These findings materially strengthen Lo Herma’s ISR development credentials.”
“We also confirmed a further 3 km of uranium mineralised trends north of Mine Units 1 and 2 from the 50-hole expansion drilling program reported in December 1. Assessment of these results is underway, with the next phase of work to be announced shortly. Both the drilling and aquifer testing programs are designed to support a larger, higher‑confidence resource and enhanced hydrogeologic understanding, ahead of a planned Mineral Resource Estimate update this quarter and an update of the Scoping Study expected in the second half of 2026.”
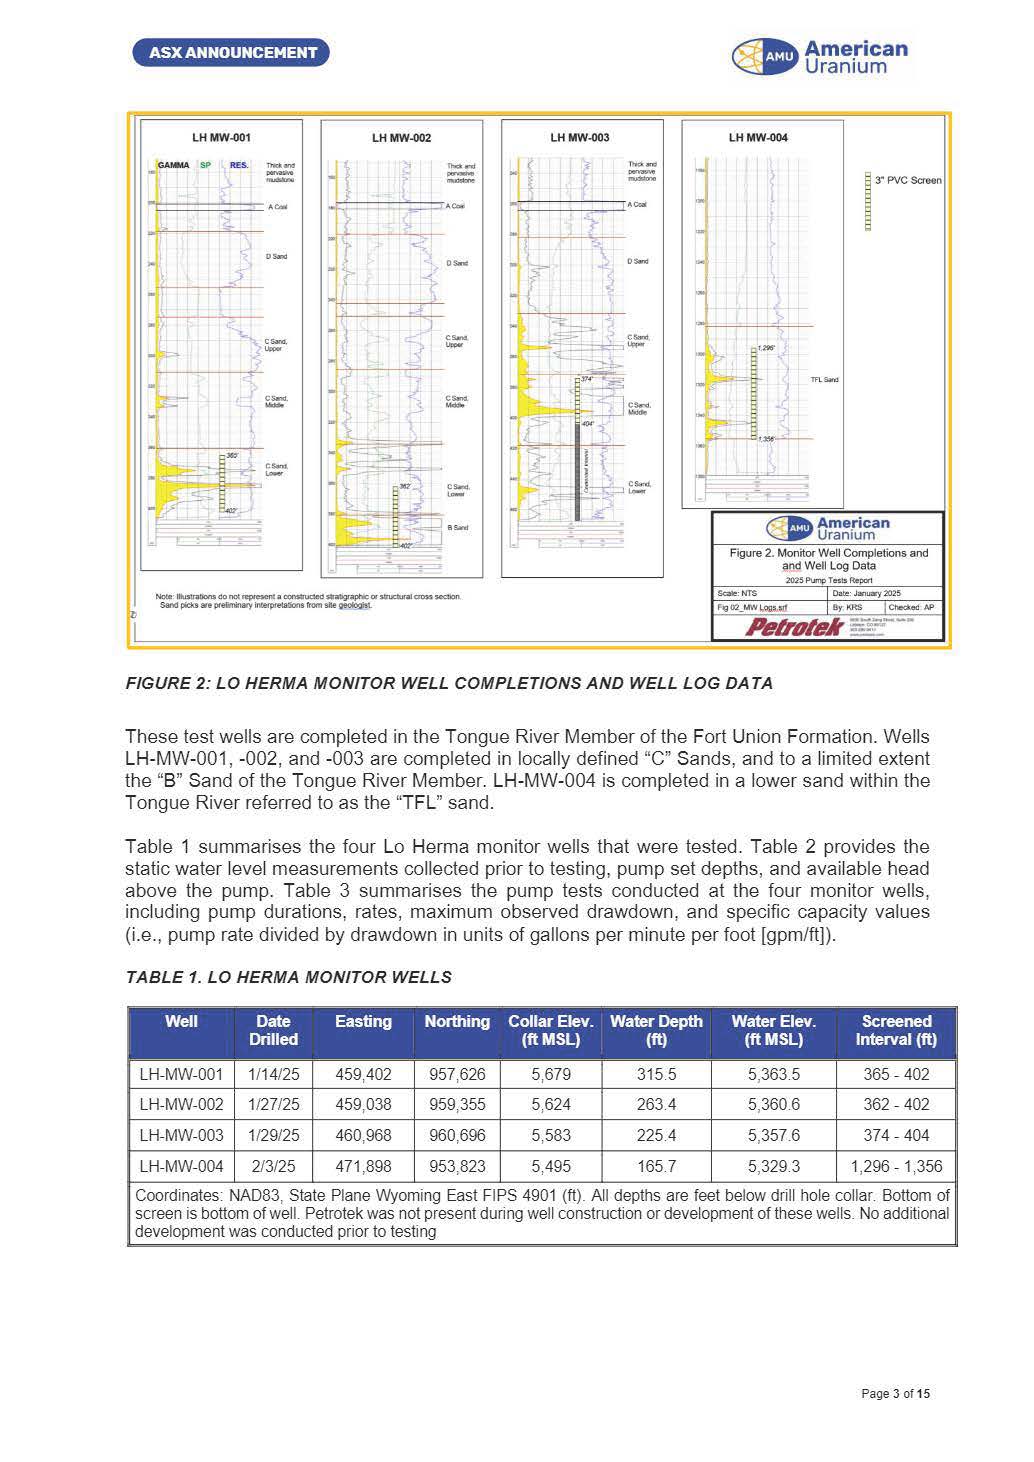
Figure 2: Lo Herma Monitoring Well Completions and Well Log Data
Lo Herma Hydrogeologic Testing Discussion
As part of the ongoing Lo Herma hydrogeology program, Petrotek designed and conducted aquifer pumping tests during November 2025 on four monitor wells2 at the Lo Herma uranium project in Converse County. The objective of testing was to conduct single-well pumping tests at four monitoring well locations to obtain aquifer properties within the uranium production zones. The objectives of testing were to determine aquifer transmissivity (T) in the production zone and demonstrate sufficient permeability to operate at designed extraction rates (approximately 20 gpm). This test program was not designed to characterise confinement of the host aquifer.
Figure 1 provides a location map of the four tested wells at the Lo Herma project site. Figure 2 illustrates the screen completion depths, well log data, and formation lithology. 2 AMU ASX Announcement: Key Milestone Achieved, Scoping Study Fieldwork & Testing Completed Confirmation of Favorable ISR Hydrogeology, 5 March 2025
These test wells are completed in the Tongue River Member of the Fort Union Formation. Wells LH-MW-001, -002, and -003 are completed in locally defined “C” Sands, and to a limited extent the “B” Sand of the Tongue River Member. LH-MW-004 is completed in a lower sand within the Tongue River referred to as the “TFL” sand.
Table 1 summarises the four Lo Herma monitor wells that were tested.
Table 2 provides the static water level measurements collected prior to testing, pump set depths, and available head above the pump.
Table 3 summarises the pump tests conducted at the four monitor wells, including pump durations, rates, maximum observed drawdown, and specific capacity values (i.e., pump rate divided by drawdown in units of gallons per minute per foot [gpm/ft]).
Pump Testing Methodology
Prior to pump installation, a static water level in each well was measured (Table 2). Then the pump was lowered to the set depths in Table 2, with the LevelTROLL® and poly cable taped to the 1-inch polyline located five feet above the pump intake. Once water levels were observed to stabilize, testing was conducted. The LevelTROLL® 700 used during testing is vented and thus compensates for changes in barometric pressure. A datalogging barometric pressure transducer (In-Situ BaroTROLL®) was employed during all testing, but no major atmospheric pressure fronts were observed and no additional corrections were required for water level data.
A step-drawdown pump test was conducted at wells LH-MW-003, LH-MW-002, and LHMW-001prior to the constant-rate pump test. Due to the large available head above the pump at well LHMW-004, only a constant-rate pump test was performed (Table 3). The three step-rate tests were conducted for a total of one hour, with three equal time steps of 20 minutes with increasing pumping rates. Following the end of pumping, water levels were recorded until recovery to near static water level conditions.
The four constant-rate pump tests were conducted for a duration of four (4) hours, with the goal of quickly establishing a constant pumping rate and monitoring flow rates to ensure a stable rate throughout the testing period. Following the end of pumping, water levels were recorded until recovery to near-static water level conditions.
Drawdown data from the pump tests were analyzed using several conventional confined aquifer and leaky confined aquifer analytical solutions. Data were analyzed using the AQTESOLV® aquifer test analysis software (version 4.5, Professional). Drawdown data from both the step-rate tests and the constant-rate tests were analyzed for transmissivity (T, units of ft2/day).
Note that transmissivity is defined as hydraulic conductivity (k, ft/day) multiplied by aquifer thickness (b, ft), such that T = k * b.
Pump Testing Summary and Conclusions
Single-well pump tests to determine aquifer transmissivity (T) were performed at four monitor wells at the Lo Herma uranium project. Estimated hydraulic conductivities (K) were also calculated. Values determined from testing are consistent with other permitted and operating ISR facilities in the southern Powder River Basin. These tests also demonstrate that the wells can produce at designed extraction rates for mining. These tests were not conducted to assess hydraulic confinement of the host production aquifer for permitting purposes.
Aquifer transmissivities were similar in scale at wells LH-MW-004, LH-MW-003, and LH-MW001.
Determined transmissivities at LH-MW-004 were from 230 – 253 ft2/d, ranged from 190 – 285 ft2/d at LH-MW-003, and from 225 – 260 ft2/d at LH-MW-001. At LH-MW-002, T values were significantly lower between 65 – 78 ft2/d. These values are consistent with other permitted and operating ISR facilities.
Hydraulic conductivities (K) were calculated from these T values, based on screen length and well log data to determine estimated total thicknesses of the pumped aquifer at each well. These calculations indicate K values at well LH-MW-004 between 3.1 and 3.4 ft/d. Higher K values were observed at wells LH-MW-003 and LH-MW-001, ranging between 5.8 and 8.6 ft/d and 5.9 to 6.8 ft/d, respectively. At LH-MW-002, K values were lower and between 1.4 and 1.6 ft/d. The hydraulic conductivities (K) observed at the Lo Herma uranium project during this round of testing are consistent with those observed at other operating ISR facilities in Wyoming.
Recommended Next Steps
The November 2025 single-well pump tests at Lo Herma assessed aquifer transmissivity in mining zones and verified 20 gpm extraction rates, but offers only a limited view of the project as a whole. Petrotek recommends developing a regional hydrogeologic model to map sands and confining layers. Local-scale geological evaluations should be designed to better define production zones, confining layers, and adjacent aquifers for monitoring.
Before permitting commences, "regional pump tests" (one per square mile, up to a week long) will be needed with production-zone observation wells for transmissivity and storativity assessment and multi-aquifer monitoring wells for confinement. Numerical modeling will be required to support WDEQ-LQD monitoring well ring spacing and excursion control requirements.
Managed & Built by I2M Consulting, LLC | © 2010-
