

Turco and 2 co-authors reported in early 2025 that the greater Houston region has undergone substantial land subsidence over the past century, with rapid subsidence occurring from the late 1940s to the 1970s and more controlled rates thereafter.
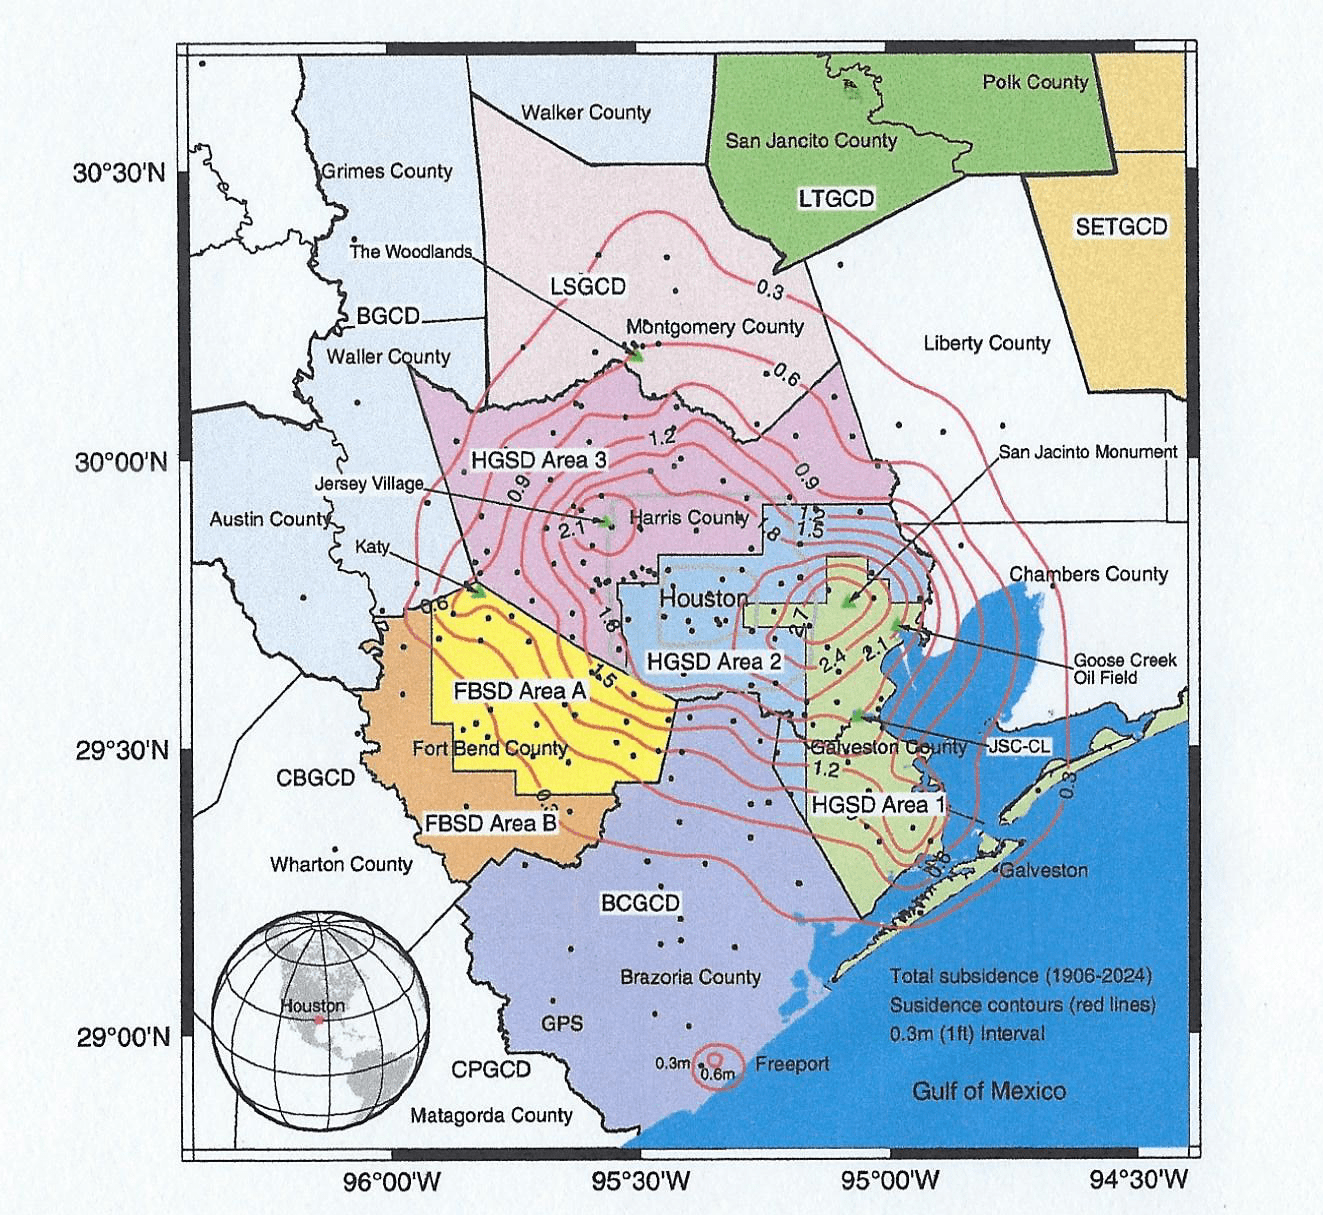 The map above depicts the Greater Houston region, highlighting areas covered by subsidence and groundwater conservation districts. Key subsidence districts and groundwater conservation districts (GCDs) include:
- HGSD (HarrisGalveston Subsidence District, Areas 1, 2, and 3);
- FBSD (Fort Bend Subsidence District, Areas A and B);
- BCGCD (Brazoria County GCD);
- CPGCD (Coastal Plains GCD);
- CBGCD (Coastal Bend GCD);
- BGCD (Bluebonnet GCD);
- LSGCD (Lone Star GCD);
- LTGCD (Lower Trinity GCD); and
- SETGCD (Southeast Texas GCD).
The contour lines illustrate the cumulative land surface subsidence (in meters) from 1906 to 2024. The dark dots indicate the 220 reference sites used to generate the subsidence contours. The majority of reference sites coincide with GPS stations. Data sources and methodologies used to create the subsidence contours are described in the “Consequences of Permanent Subsidence: Groundwater Storage Capacity Loss” section of this paper.
The establishment of the Harris-Galveston Subsidence District (HGSD) in 1975 marked a pivotal milestone in subsidence management, primarily by regulating previously uncontrolled groundwater extraction. HGSD’s success in reducing subsidence while simultaneously fostering robust economic growth in the Houston area inspired the creation of the Fort Bend Subsidence District (FBSD) in 1989.
By 2024, significant subsidence (>0.3 m from 1906 to 2024) had impacted an area of approximately 12,000 km2, encompassing nearly all of Harris and Galveston Counties, as well as parts of the surrounding counties. This subsidence led to an irreversible loss of around 12 km3 of groundwater storage capacity—equivalent to 60 times the volume of Lake Houston, or roughly 8 years’ worth of water usage for Harris and Galveston Counties as of 2023. About 65% of this loss occurred before HGSD regulations (1906-1978), 20% between 1979 and 2000, and 15% since 2001. Due to groundwater regulations, the extent of subsidence has decreased significantly since the 1990s.
By the early 2020s, the areas experiencing subsidence rates exceeding 1 cm/year had decreased to 1500 km2, roughly one-twentieth of the greater Houston region, with only 50 km2 seeing rates above 2 cm/year. The highest current subsidence rate, approximately 3 cm/year since 2020, occurs in the Katy area, Fort Bend County. This review provides a comprehensive overview of land subsidence and groundwater level monitoring in the greater Houston region, highlighting regulatory developments, technological advancements, key research findings [see Campbell, et al., in text and here: 2018], and the continuing challenges of achieving sustainable groundwater management.
Managed & Built by I2M Consulting, LLC | © 2010-
