

Qu and three co-authors reported in 2019 that growth faults are widely distributed in the Greater Houston (GH) region of Texas, USA, and the existence of faulting could interrupt groundwater flow and aggravate local deformation. Faulting-induced property damages have become more pronounced over the last few years, necessitating further investigation of these faults.
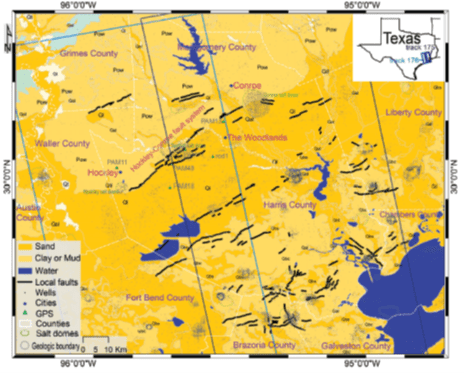 Geological map of GH [8], where colors represent generalized lithology, and black letters (Ql—Lissie Formation; Pow—Willis
Formation; Qb—Beaumont Formation; Qbs—Beaumont Formation (sand); Qbc—Beaumont Formation (clay); Qal—Alluvium; Qt—
Fluviatile terrace deposits) and grey lines show distribution of the major geologic units [1]. Faults (marked by black lines)
[9,10], hydrocarbon wells (small grey dots [11]), GPS benchmarks (green triangles), salt dome positions (green polygons)
and county boundaries (white dashed lines, county names are labeled by purple letters) are superimposed. The blue and black
rectangles show coverage of two neighboring Advanced Land Observing (ALOS) data. The Texas State district is shown as an
inset map on the upper-right corner.
Interferometric synthetic aperture radar (InSAR) has been proved to be an effective way for mapping deformations along and/or across fault traces. However, extracting short-wavelength small-amplitude creep signal (about 10–20 mm/yr) from long time span interferograms is extremely difficult, especially in agricultural or vegetated areas.
The authors located, mapped, and monitored the rate, extent, and temporal evolution of faulting over GH at the highest spatial density using Multi-temporal InSAR (MTI) technique. The MTI method, which maximizes usable signal and correlation, has the ability to identify and monitor faulting and provide accurate and detailed depiction of active faults. Two neighboring L-band Advanced Land Observing (ALOS) tracks (2007–2011) are utilized in this research. Numerous areas of sharp phase discontinuities have been discerned from MTI-derived velocity map. InSAR measurements allow us to position both previously known faults traces as well as nucleation of new fractures not previously revealed by other ground/space techniques.
Faulting damages and surface scarps were evident at most InSAR-mapped fault locations throughout our their investigations. The newly discovered fault
activation appears to be related to excessive groundwater exploitation from the Jasper aquifer in Montgomery County. The continuous over-producing of groundwater from the Jasper aquifer formed new water-level decline cones over Montgomery County, corroborating the intensity of new fractures.
Finally, the authors elaborated the localized fault activities and evaluated the characteristics of faulting (locking depth and slip rate) through modeling MTI-derived deformation maps. The SW–NE-oriented faults pertain to normal faulting with an average slip rate of 7–13 mm/yr at a shallow locking depth of less than 4 km.
Identifying and characterizing active faults through MTI and deformation modeling can provide insights into faulting, its causal mechanism and potential damages to infrastructure over the GH.
Managed & Built by I2M Consulting, LLC | © 2010-
